
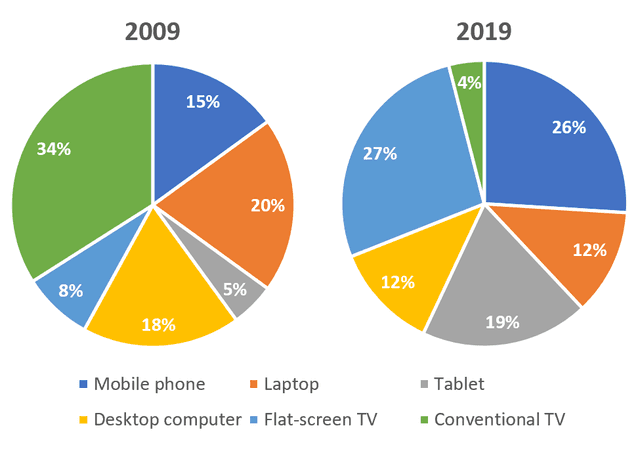
The two
pie
charts provide data about how a group aged, 18 to 25 Use synonyms
years
old, consumed Use synonyms
TV
shows in the Use synonyms
years
2009 and 2019 in Canada. The Use synonyms
pie
charts are divided into 6 different categories; each one is a device to consume Use synonyms
TV
content.
As can be observed in the first Use synonyms
pie
chart, in the year 2009 the most popular device used by people in Canada to watch television is the conventional Use synonyms
TV
, with 34% of the total amount. Use synonyms
However
, 10 Linking Words
years
later, in 2019, as the second Use synonyms
pie
chart illustrates, Use synonyms
this
percentage dropped drastically. Just 4% of the age group use traditional television to consume Linking Words
TV
programs. Use synonyms
Overall
, the conventional Linking Words
TV
goes from the most used device to the most unpopular one, in the interval of 10 Use synonyms
years
.
Use synonyms
Besides
that, we can Linking Words
also
see how the use of flat-screen Linking Words
TV
and tablet to watch Use synonyms
TV
has increased over the Use synonyms
years
: from 8% to 27% and from 5% to 19% respectively. Use synonyms
In addition
, the second chart shows the use of flat-screen Linking Words
TV
and mobile phone became a trend among younger people to consume Use synonyms
TV
content.Use synonyms