
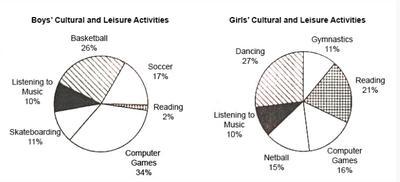
The given pie charts illustrate the proportion of
time
allotted by the children to do cultural and Use synonyms
leisure
activities in their free Use synonyms
time
and the data segregate by sex and gender.
Use synonyms
Overall
, Linking Words
boys
arrange their relaxation most in front of the computer playing games ,Use synonyms
Linking Words
similarly
the Add a comma
,similarly
girls
spend their free Use synonyms
time
dancing more than other activities. Use synonyms
Moreover
, Linking Words
boys
spent their Use synonyms
time
on reading activities only 2% Use synonyms
while
Linking Words
girls
spent ten times more. (Use synonyms
In addition
, Linking Words
boys
spent most of their free Use synonyms
time
doing sports with 54% than the Use synonyms
girls
only half.
Looking into detail, it is apparent that Use synonyms
boys
like to spend their free Use synonyms
time
playing games on the computer at 34%, followed by sport exercise : playing basketball, playing soccer, and skateboarding at 26%, 17% and 11% respectively. Reading becomes the least activity done by the Use synonyms
boys
, they only spend 2% of their Use synonyms
leisure
Use synonyms
time
. Use synonyms
In contrast
, Linking Words
girls
almost only spend 16% of their free moment playing computer games. They spend use /allocate /allot the majority of they their Use synonyms
leisure
do dancing at 27%, and reading in second place at 21%. Similar to the Use synonyms
boys
, the Use synonyms
girls
Use synonyms
also
arrange their free Linking Words
time
to do sports exercises like netball (15%) and gymnastics (11%). Use synonyms
Moreover
, Linking Words
girls
allocate the same proportion as Use synonyms
boys
for listening to music 10% of their Use synonyms
leisure
Use synonyms
time
.Use synonyms