The charts below show that percentage of their daily intake of various nutrients the average person in the USA consumes in each meal and in snacks. These nutrients may be unhealthy if eaten too much. Summarie the information by selecting and reporting the main features, and make comparisons where relevant.

The charts below show that percentage of their daily intake of various nutrients the average person in the USA consumes in each meal and in snacks. These nutrients  may be unhealthy if eaten too much.

Summarie the information by selecting and reporting the main features, and make comparisons where relevant.
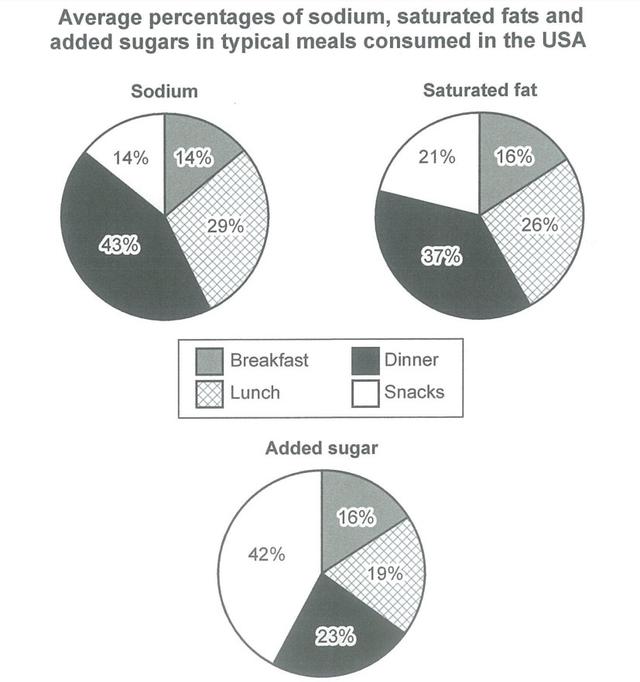
The chart illustrates the average intake of a diverse range of nutrients an American consumes during each meal.
Overall
, we can identify that saturated fat and sodium are key ingredients during lunch and dinner,
whereas
added sugar and other nutrients mentioned have been relatively similar during breakfast.
Submitted by vanshbisht11 on

Unauthorized use and/or duplication of this material without express and written permission from this site’s author and/or owner is strictly prohibited. Excerpts and links may be used, provided that full and clear credit is given to Writing9 with appropriate and specific direction to the original content.

Sentences: Add more complex sentences.
Basic structure: Write more paragraphs.
Basic structure: Add more body paragraphs.
Common mistake: Your writing should be 150-250 words.
Basic structure: Write more paragraphs.
Vocabulary: Only 2 basic words for charts were used.
Vocabulary: Use several vocabularies to present the data in the second paragraph.
What to do next:
Look at other essays: