
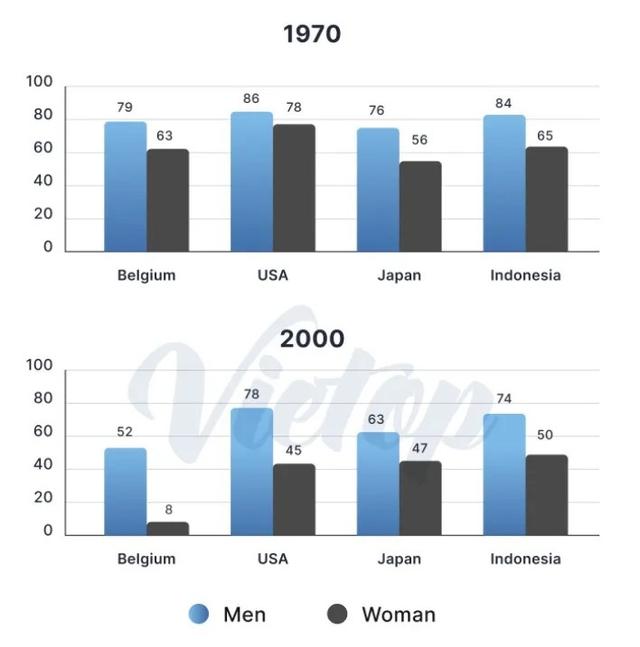
The two given bar charts illustrate the comparison between men and women aged 60-64 who worked in four countries (Belgium, USA, Japan and Indonesia) in the years 1970 and 2000. Units are measured in percentage.
Overall
, it can clearly be seen that the number of workers had a downtrend.
In terms of the men worker, the USA and Indonesia which had almost the same number of men at about 85% at the beginning of the period experienced a slight decrease to precisely 78% and 71%, respectively. Linking Words
In addition
, Belgium and Japan which stood at the range of 75%-78% dropped significantly to just a little bit over 50% after 30 years.
Regarding women employees in 1970, the USA was in the first position at under 80% and went down drastically to exactly 41%. Linking Words
Moreover
, Indonesia and Japan started at 65% and 55% but they decreased to around 59% and 60%. Interestingly, Belgium which began with 62%, witnessed a drastic drop to just 8%.Linking Words