
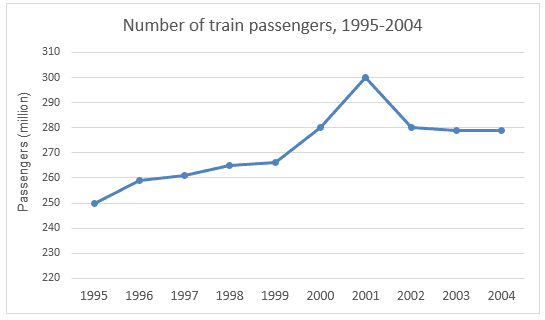
The first graph illustrates the number of passengers travelling by train in Sydney from 1995 to 2004,
while
the second line graph gives information about how many percentages of trains Linking Words
running
on Wrong verb form
ran
time
in the same duration.
Use synonyms
Overall
, Linking Words
while
the percentage of passengers rose during Linking Words
the
Correct determiner usage
that
time
, the proportion of trains running on Use synonyms
time
decreased, and there was a sharp fall by the end of the age.
At the start of the Use synonyms
period
the number of travellers accounted for 250 Add a comma
,period
million
. Use synonyms
Then
, Linking Words
this
figure slowly increased from 250 to 265 Linking Words
million
over four years. After that, there was a sharp rose to 300 Use synonyms
million
in 2001, which was a peak of passengers during the whole period. Use synonyms
Next,
Linking Words
this
number decreased to 280 Linking Words
million
Use synonyms
at the end
of the period.
With regards to the percentage of trains running on Linking Words
time
, in the beginning, it could be seen that there was around 93% of success cases. Use synonyms
Nevertheless
, the rate dropped to just over 85% in 1997. Linking Words
Moreover
, Linking Words
this
figure fluctuated and reached a peak at 90% in 2003. Linking Words
Finally
, 2004 experienced a sharp drop to 73% in 2004.Linking Words