
This
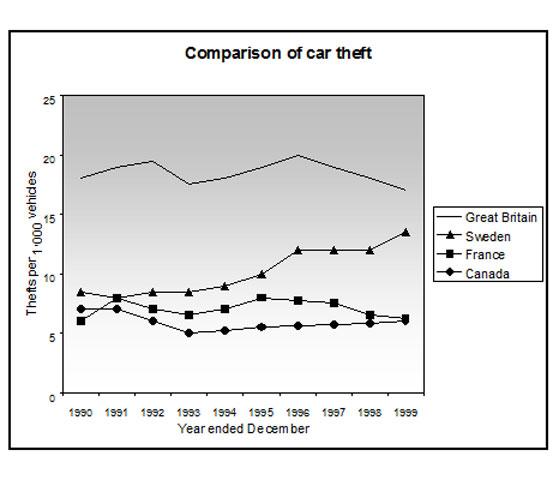
provided line graph compares the number of car Linking Words
thefts
per thousand of the population in European countries from 1990 to 1999, in a period of 9 years. Use synonyms
Overall
, it can be seen that automobile Linking Words
thefts
in Great Britain were far higher than in the other three countries throughout the whole time frame.
Use synonyms
To begin
, vehicle Linking Words
thefts
have a similar pattern in Sweden, France, and Canada over the first five years of the period, all remaining at a range between 7 and 9 per thousand. Use synonyms
However
, there was a decline in the number of vehicles stolen in France and Canada, both stopped at 6, Sweden experienced an upward trend, and finished at just below 15.
Linking Words
On the other hand
, car Linking Words
thefts
in the UK started at nearly 18, which far exceeded the other countries. After ,that it fluctuated over the next 9 years to reach a peak of 20 cars per thousand, in 1996. Yet it dropped gradually to end at just around 17, where it was lower than it began.Use synonyms