
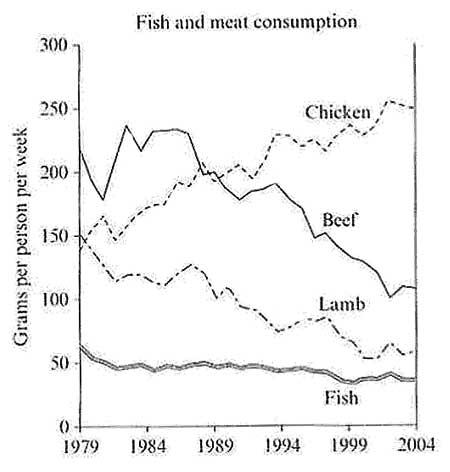
The line graph illustrated
fish
and meat consumption per Use synonyms
week
in a European country. Use synonyms
Overall
, Linking Words
fish
ingestion every Use synonyms
week
has always been Use synonyms
on
Change preposition
at
the
lowest since 1979 until 2004. Change the word
its
Additionally
, beef is the most popular amongst the Linking Words
europeans
in 1979 which marks the most ingested in a Change the capitalization
Europeans
week
for a single person of 220 Use synonyms
grams
.
Looking at the details, lamb and chicken Use synonyms
was
eaten 150 Correct subject-verb agreement
were
grams
and 140 Use synonyms
grams
respectively weekly by an individual in 1979, Use synonyms
although
lamb will see a decrease in trend and eventually reached a bottom of 60 Linking Words
grams
a Use synonyms
week
Use synonyms
while
chicken continues to climb and hit the highest in the graph at 240 at the year 2004.
Now turning to beef and Linking Words
fish
, we can see that beef was the most popular meat in 1979 will start declining in 1987 and at Use synonyms
last
Linking Words
fall
to 110 Replace the word
fell
grams
in one Use synonyms
week
coming in second as the choice of meat by europe people in 2004, Use synonyms
while
Linking Words
fish
have always been the least favourite food since 1979 starting at 51 Use synonyms
grams
and come to only 49 Use synonyms
grams
of Use synonyms
fish
weekly in 2004.Use synonyms