
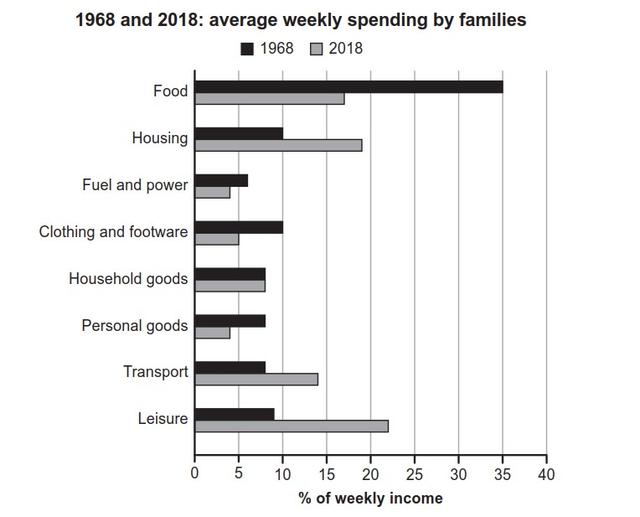
The bar charts illustrate information about the proportion of
money
that families spent weekly income on their expenditures in 1968 and 2018. Use synonyms
Overall
, it can be seen that the highest percentages in 1968 were spent on Linking Words
food
,Use synonyms
while
the lowest percentages in 2018 were spent on Fuel and power and Personal goods. Linking Words
Moreover
, spending on household goods in both years was the same proportion.
In 1968, Linking Words
Food
was the largest amount of their spending, which was 35% of their income. The second highest percentages were for housing and clothing and footwear, which were 10 %. Use synonyms
In addition
, the rest of expenditures were spent approximately just under 10% of income, except fuel and power was the lowest proportion that people spent Linking Words
money
on it around just over 5 %
In 2018, people in the city spent Use synonyms
money
on their leisure at almost a quarter, which was the biggest percentage. Housing and Use synonyms
food
were spent almost the same at just under 20% ,which was the most second fundamental expenditure spending ,and spending on Use synonyms
food
was exceeded into Use synonyms
second
rank Change the article
the second
instead
of clothing and footwear in 1968. Linking Words
While
the amount of Linking Words
money
that people spent on household goods was the same at just under 10 %.Use synonyms