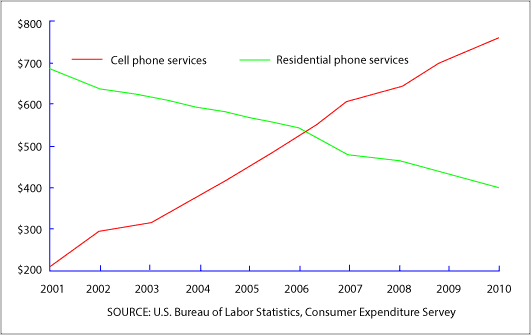
The line graph below shows US consumers' average annual expenditures on cell phone and residential phone services between 2001 and 2010.

The line graph below shows US consumers' average annual expenditures on cell phone and residential phone services between 2001 and 2010.
IELTS Writing Task Chart for The line graph below shows US consumers' average annual expenditures on cell phone and residential phone services between 2001 and 2010.
The graph provides details about the average annual amount spent by individuals in the United States on both mobile and landline telephone connections from 2001 to 2010.
Overall
Linking Words
, expenditure on mobile phones saw a dramatic and steady climb, eventually outstripping the amount allocated to fixed-line connections.
In contrast
Linking Words
, money directed towards residential telephony steadily diminished, reflecting a clear change in consumer habits. In the early part of the decade, almost $700 was allocated to traditional home communication,
whereas
Linking Words
outlay for mobile usage was just $200. As the period progressed, funds devoted to mobile technology rose swiftly, matching landline costs at around $500 midway through the timeline, a point which marked a significant transition.
Subsequently
Linking Words
, the trend for mobiles maintained its upward trajectory, surpassing $750 by the close of the period under review. Meanwhile, the sum dedicated to household telephony continued to decrease, reaching close to $400.
This
Linking Words
data demonstrates a pronounced movement away from conventional fixed-line options towards portable communication devices among Americans.

Unauthorized use and/or duplication of this material without express and written permission from this site's author and/or owner is strictly prohibited. Excerpts and links may be used, provided that full and clear credit is given to Writing9 with appropriate and specific direction to the original content.

Vocabulary: The word "amount" was used 2 times.
What to do next:
Look at other essays: