
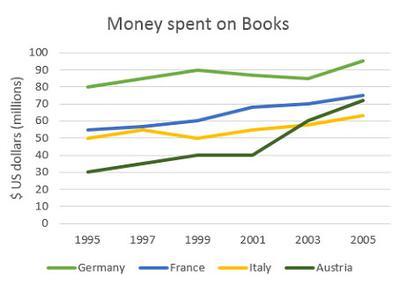
The provided line graph gives information about the expenses of books in the four different countries over a ten-year
period
, between 1995 and 2005.
Use synonyms
Overall
, what stands out from the graph is that there was an upward trend through the Linking Words
period
. The other significant feature of Use synonyms
this
graph is that Austria saw significant spending more money than other countries.
Looking at the details, the expenses of France and Austria were a notable increase during the whole Linking Words
period
, starting at just under 60 and 30 Use synonyms
million
dollars at the beginning of the Use synonyms
period
, in 1995. In terms of Austria increased its value to 40 Use synonyms
million
dollars in 1999, remaining until 2001. After that, the value jumped to over 70 Use synonyms
million
. As regards France, there was a moderate rose to relatively just over 75 Use synonyms
million
.
Now turning to Germany and Italy, there was an upward trend despite less than others. Spending of Germany and Italy increased from just under 50 and 80 to over 60 and roughly over 95 Use synonyms
million
dollars respectively with some fluctuations in the Use synonyms
period
of 10 years. Use synonyms
At the end
of the Linking Words
period
, Germany held the highest expenditure on books and Italy was the least value.Use synonyms