
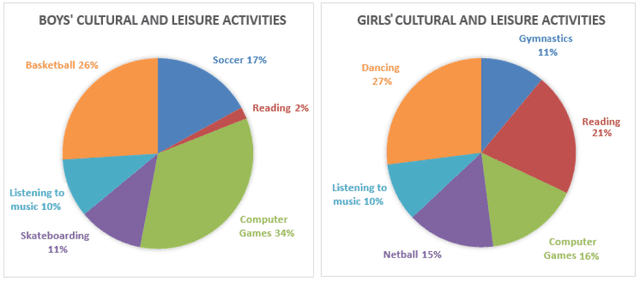
The two given pie charts illustrate the statistics of a study about the preference of boys and
girls
for leisure Use synonyms
activities
.
Use synonyms
Overall
, Linking Words
it is clear that
the only similar figure was listening to music for boys and Linking Words
girls
. Use synonyms
In addition
, boys preferred to play outdoor Linking Words
activities
Use synonyms
whereas
Linking Words
girls
chose to play indoor Use synonyms
activities
Use synonyms
instead
.
Turning to boy’s leisure Linking Words
activities
, the percentage of playing computer games was the highest at 34%, slightly higher than the figure for playing basketball Use synonyms
with
26% which left the proportion of reading far behind, at just 2%. Listening to music, skateboarding and soccer were less popular with 10%, 17% and 11% respectively.
Moving to the girl’s graph, the percentage of dancing and reading took the leading position Change preposition
at
with
27%, followed by the preference Change preposition
at
of
reading Change preposition
for
with
21%. Interestingly, the number of computer games and netball was similar with 16% for the former and 15% for the latter. Change preposition
at
Similarly
, Linking Words
girls
allocated time for doing gymnastics and listening to music at around 10%.Use synonyms