
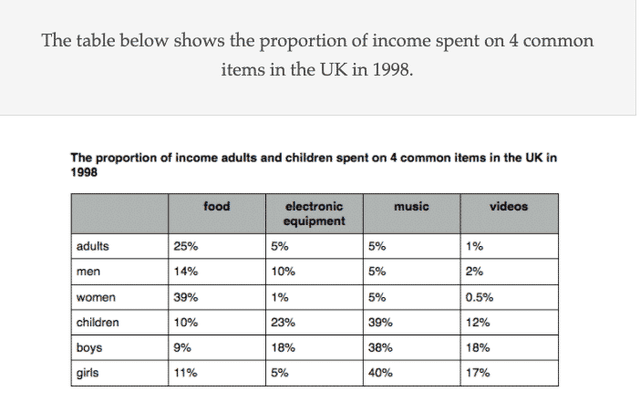
The table illustrates information about the expenditure of the UK people on various 4 items
such
as food,electronic equipment,Linking Words
music
and videos in the year 1998.Use synonyms
However
,units had been mentioned in Percentages.
Linking Words
Overall
Linking Words
it is clear that
teenagers were the biggest consumers of electronic equipment and Linking Words
music
Use synonyms
whereas
adults spend most on foodstuff rather than all other items.Linking Words
Although
,Linking Words
boys
were the biggest consumer of all various items.
In terms of expenditures on food , women got the highest ranking with 39% spending and teenagers (including Use synonyms
boys
,girls and children) were spending very small amounts between 9% and 11% on food as compared to electronic equipment which was highly prefered by children and Use synonyms
boys
as they spend 23% and 18% respectively Use synonyms
whereas
women spent smallest income only 1%.
Linking Words
On the other hand
,Linking Words
music
was highly prefered by all of the young generation Use synonyms
such
as Linking Words
boys
,girls and children as they spend 38% ,40% and 39% respectively Use synonyms
whereas
aged people spend 5% on Linking Words
music
as compared to videos which were most precious among Use synonyms
boys
as they spent 18% on it Use synonyms
while
women spent 0.5% on videos.Linking Words