
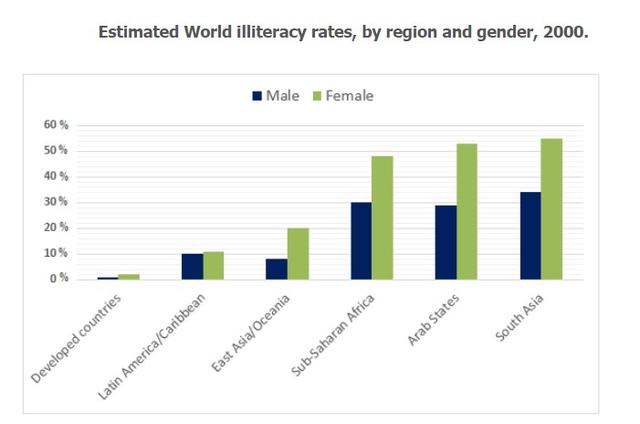
The given bar chart compares the proportion of people who are illiterate in the world by area and by sex for the
last
year.
Linking Words
Overall
, South Linking Words
Asia
, Arab States, and Sub-Saharan Africa had the highest percentage of illiterate people in the Use synonyms
last
year. It is Linking Words
also
noticeable that the illiteracy rates of females were significantly higher than that of males.
The amount of females who were unlettered in South Linking Words
Asia
is about 55% in South Use synonyms
Asia
, Use synonyms
while
the proportion of Linking Words
this
gender in the Arab States and Sub-Saharan Africa was slightly lower, over 50% and 48% respectively. The illiterate woman in Latin America and the Caribbean, over 10%, was almost half the figure in East Linking Words
Asia
and Oceania. Illiteracy rates in other countries which were developing were lowest, only approximately 2%.
The quantities of men who are illiterate are considerably less than the number of women. The highest percentage was in South Use synonyms
Asia
and Sub-Saharan Africa 35% and over 30% respectively, Use synonyms
whereas
Linking Words
this
figure in the Arab States, around 10%, was triple that of Latin America and the Caribbean.Linking Words