
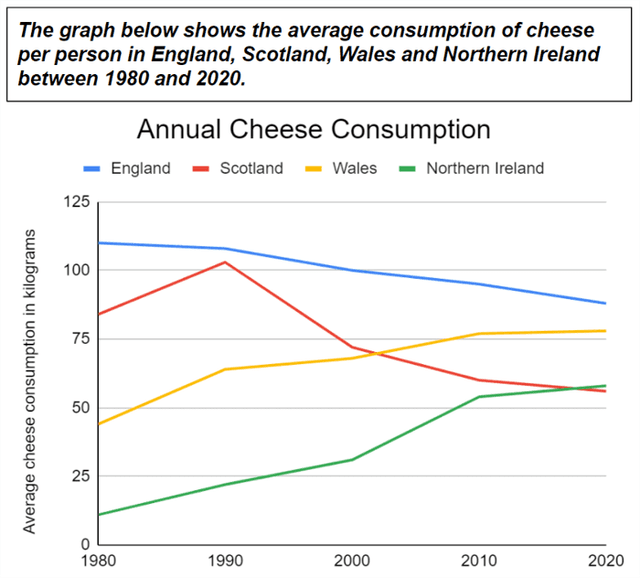
The chart illustrates the annual cheese usage in four countries between 1980 and 2020. The units were measured in kilograms.
Overall
, England experienced the highest proportion of cheese consumption compared with other countries. Linking Words
Likewise
, Northern Ireland recorded the lowest rate. Both Northern Ireland and Wales reported an upward rate of cheese usage during the period. Linking Words
In contrast
, England showed a slightly decreased rate between 1980 to 2020. Linking Words
Furthermore
,Scotland fluctuated during the years.
In terms of England, the average consumption per person started at more than 100 in 1980 and Linking Words
then
showed a small decline until reached around 80 in 2020. Linking Words
Likewise
,Scotland began at nearly 80 in 1980 and Linking Words
then
rosed until reached a peak of roughly 100 in 1990. Afterwards, it demonstrated a significant fall until reaching more or less 55 in the final year.
Northern Ireland began with close to 15 in 1980 and Linking Words
then
steadily rose until reaching almost 55 in 2020. Compared with Wales, started at under 50 in 1980 and Linking Words
then
climbed until reached more than 80 in the Linking Words
last
year.Linking Words