The pie chart below shows where energy is used in a typical Australian household, and the table shows the amount of electricity used according to the number of occupants.

The pie chart below shows where energy is used in a typical Australian household, and the table shows the amount of electricity used according to the number of occupants.
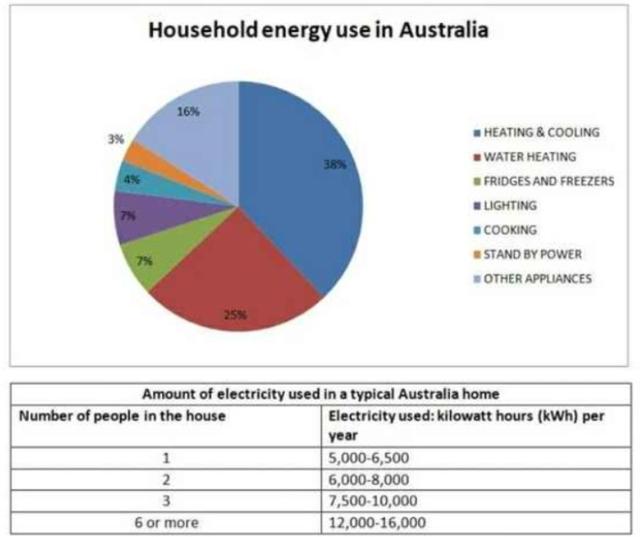
The pie chart illustrates the percentage of energy distribution in
Astralian
Correct your spelling
Australian
household
Fix the agreement mistake
households
show examples
,
,
Change the punctuation
apply
show examples
However
Add a comma
,However
show examples
the table depicts the proportion number of usage electricity
of
Change preposition
by
show examples
occupants per year in the units measured by kilowatts per year.
overall
, it's clear that Heating and cooling presented the highest ratio of energy consumption volume around 38% and 25% of the whole total.
secondly
cooking occupied the high figure about approximately 4%
additionally
stand power stead
in
Change preposition
at
show examples
the same level in 3%kiloatt
Submitted by Ssaraan2017 on

Unauthorized use and/or duplication of this material without express and written permission from this site’s author and/or owner is strictly prohibited. Excerpts and links may be used, provided that full and clear credit is given to Writing9 with appropriate and specific direction to the original content.

Sentences: Add more complex sentences.
Basic structure: Write more paragraphs.
Basic structure: Add more body paragraphs.
Common mistake: Your writing should be 150-250 words.
Basic structure: Write more paragraphs.
What to do next:
Look at other essays: