
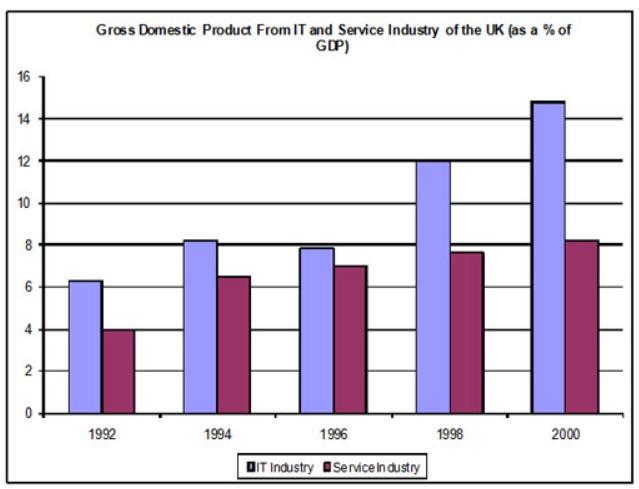
The given bar chart illustrates the proportions of gross domestic product from the informational technology and service
industry
in the United Kingdom between 1992 and 2000.
Use synonyms
Overall
, it can be seen from the chart that the IT Linking Words
Use synonyms
industry
Change noun form
industry's
GDP
was ahead of the assistance Use synonyms
industry
Use synonyms
while
rising throughout the given period.
Linking Words
To begin
with, Linking Words
technological
sphere's Correct article usage
the technological
GDP
constituted just over 6 per Use synonyms
cent
in 1992, which went up to a little more than 8 per Use synonyms
cent
in 1994. After a slight decrease in 1996, it experienced a dramatic increase in the next 4 years, accounting for 12 per Use synonyms
cent
in 1998, and hitting the highest point at more than 14% in 2000.
In 1992, service Use synonyms
industries
percentage of Change noun form
industries'
industry's
GDP
reached 4 per Use synonyms
cent
, which Use synonyms
then
rose Linking Words
up
to approximately 7% in 1994. Afterwards, it had steady growth for 6 years, resulting in a bit more than 8% in 2000. Considering all the written data, it can be seen that during the whole period of eight years service Change preposition
apply
industry
's Use synonyms
GDP
could not exceed IT's.Use synonyms