
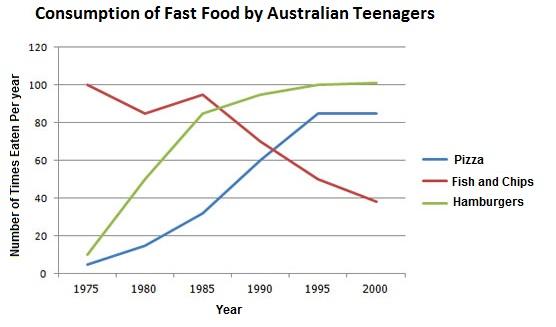
The given line graphs
presents
the quantity and kind of Change the verb form
present
the
fast food utilized by Correct article usage
apply
the
Australian Correct article usage
apply
childern
in their Correct your spelling
children
teen
ages. The diagram shows Replace the word
teenage
this
information between the Linking Words
Use synonyms
year
1975 to 2000.
The line graph presents the years on Fix the agreement mistake
years
X-coordinate
and the count of Correct article usage
the X-coordinate
meal
per Fix the agreement mistake
meals
year
. The food taken by the teenagers falls into three categories named Use synonyms
Pizza
, Use synonyms
Fish
and Use synonyms
Chips
, and Use synonyms
Hamsburgers
. In the Correct your spelling
Hamburgers
year
1975, the Use synonyms
Pizza
was eaten Use synonyms
least
number of Correct article usage
the least
times
, on average between 5-7 Use synonyms
times
. Use synonyms
However
, Linking Words
Hamsburgers
were served Correct your spelling
Hamburgers
for
approximately 10 Change preposition
apply
times
. Alternatively, in the same Use synonyms
year
, Use synonyms
for
about 100 Change preposition
apply
times
, Use synonyms
the
Correct article usage
apply
Fish
and Use synonyms
chips
were given to children. Use synonyms
Moreover
, in the Linking Words
year
38 Use synonyms
fish
and Use synonyms
chips
, 85 Pizzas, and 100 Hamburgers servings were made.
The trend of eating Use synonyms
Fish
and Use synonyms
chips
declined till the Use synonyms
year
1980, but Use synonyms
then
a sudden rise was noted Linking Words
uptill
Correct your spelling
up till
Use synonyms
year
1985. Change the article
the year
However
, Linking Words
after
1985 till 2000, Change preposition
from
the
Correct article usage
apply
Fish
and Use synonyms
Chips
were not so Use synonyms
pouplar
among teen group people. Correct your spelling
popular
In addition
, the Hamburgers Linking Words
were
became famous between 1975 to mid of 1985. After Unnecessary verb
apply
the
half Correct article usage
apply
year
Use synonyms
the
hamburgers Correct article usage
apply
were
had Unnecessary verb
apply
a
very little demand. Correct article usage
apply
In contrast
, Linking Words
pizza
became a choice Use synonyms
of
teens from 1975 to 1995. Change preposition
for
After
1975 to 2000 the Change preposition
From
pizza
Use synonyms
were
not taken more than 80.
Change the verb form
was
To sum up
, the line graph shows the food that was taken by Linking Words
australian
teenagers from 1975 to 2000. The figure shows the difference between the items Change the capitalization
Australian
such
as Linking Words
pizza
, Use synonyms
fish
and Use synonyms
chips
, and Use synonyms
hamsburger
.Correct your spelling
hamburger
hamburgers