
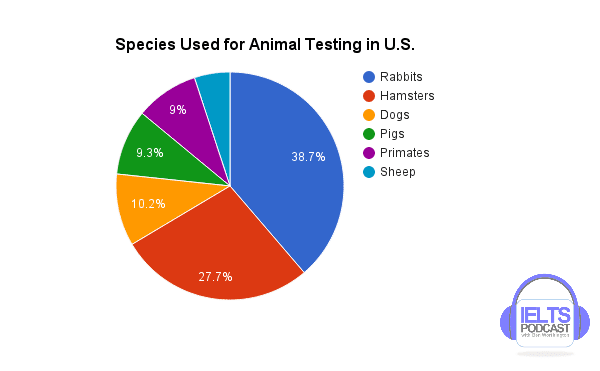
The graph illustrates the details of animal testing in the U.S., tested with
rabbits
, hamsters, dogs, pigs, primates, and Use synonyms
sheep
. The most popular Use synonyms
species
are Use synonyms
rabbits
; Use synonyms
sheep
hold the smallest amount of Use synonyms
this
statistic.
Linking Words
To begin
with, Linking Words
rabbits
share the highest portion of the test, accounting for 38.7 %. Use synonyms
Then
, the percentage of Linking Words
rabbits
is higher than the second common Use synonyms
species
hamster, by roughly ten per cent.
As for the concentration of dogs, pigs, and primates, both have a similar position, which both hold for approximately 10 per cent of the total. Surprisingly, the ratio of Use synonyms
sheep
only shares 5 per cent of the total proportion, which is only a tenth of the Use synonyms
rabbits
.
Use synonyms
To sum up
, Linking Words
rabbits
are the majority of Use synonyms
species
used for animal testing in the United States. In comparison, Use synonyms
sheep
is the least popular animal among all the Use synonyms
species
. Interestingly, there are three animals that made up a similar percentage of the data.Use synonyms