
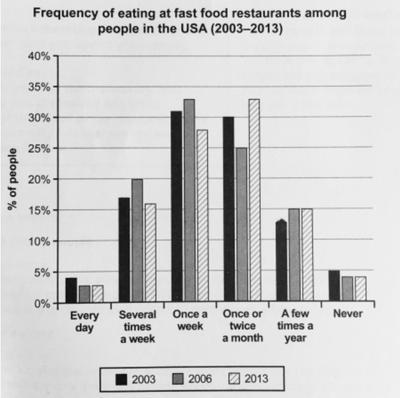
The given bar chart demonstrates the frequency of people eating at fast food restaurants in the USA and how it is changed from 2003 towards 2013.
Overall
, the frequencies do not seem to be altered significantly.
Interestingly, individuals who eat junk food every day and who never eat remained lower than 5 per cent Linking Words
while
the 'once a week' column decreased from 31% to 27% throughout the ten years. Linking Words
Similarly
, people who eat once or twice a month had an alternation of approximately 3% but in the opposite direction.
Linking Words
In addition
to Linking Words
this
, the highest numbers belong to the 'once a week' column in 2003 and 2006; Linking Words
however
, it switched to the 'once or twice a month' bar in 2013. Considering the skyrocketing obesity cases, which are already very concerning, it can be clearly inferred that healthcare campaigns targeting to plummet the consumption of foodstuffs which are high in trans fats are failing from the high rate of fast food consumerism among the American people.Linking Words