
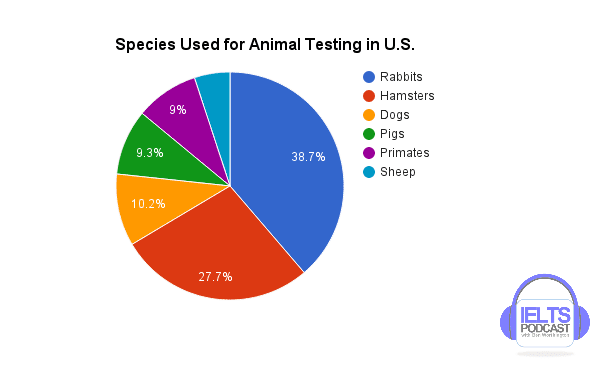
The pie chart gives information about the proportions of six types of animals, say,
rabbits
, hamsters, dogs, pigs, primates and sheep, employed by scientific and medical tests in America.
Use synonyms
Overall
, it is obvious that all experimental subjects are mammals, in which Linking Words
rabbits
account for the biggest share Use synonyms
while
sheep is the least popular one in experiments.
In experimental tests, 38.7% of them select Linking Words
rabbits
as testing objectives, ranking first among all species, which, Use synonyms
however
, is followed by hamsters, at 27.7%. Linking Words
By contrast
, the figure for sheep is only 5.1%, recording the lowest number on the pie chart.
The percentage of the left three species combined only comes in at approximately 30%, which is higher than that of Linking Words
rabbits
, yet lower than the number of hamsters. To be specific, 10.2% of testing targets are used by dogs, Use synonyms
whereas
the percentages of pigs and primates merely stand at 9.3% and 9% respectively.Linking Words