
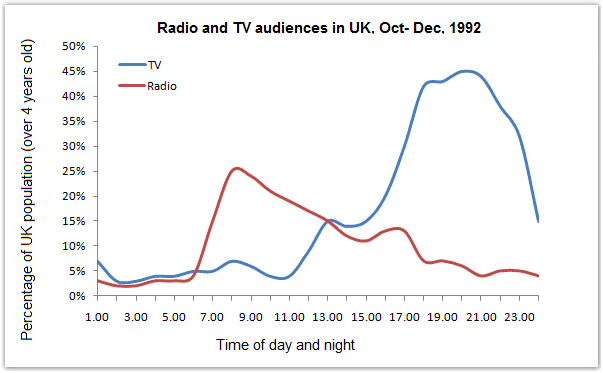
The given line graph gives information about the percentage of UK the United Kingdom’s(write words in full) Population who watched
radio
and Use synonyms
television
both day and night in 1992.
As can be clearly seen from the line graph, the most noticeable feature is that audio peaked in the evening hours Use synonyms
while
Linking Words
radio
rocketed in the morning during the experienced examined year. Use synonyms
In particular
, at the beginning of the examined hour, the percentage of people who watched watching Linking Words
television
at six before noon was zero, Use synonyms
whereas
the Linking Words
radio
audience reached a percentage of approximately 7% at the same hour. The Use synonyms
radio
audience peaked at 8 am with about 30% of viewers and Use synonyms
then
started a downward trend until 2 am where when it reached the lowest proportion of people. Linking Words
According to
Linking Words
television
audiences, after 6 am it fluctuated until 8 pm where when it surged spectacularly with up to 40% of the UK British population and Use synonyms
then
experiences experienced a dramatic decrease at two midnight equally to the transmission audience.
Linking Words
Overall
, Linking Words
television
attracts attracted more viewers throughout the experienced examined year than Use synonyms
radio
both media peaked at different times.Use synonyms