
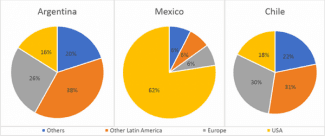
The given pie charts illustrate the percentage of the destination of export goods in three distinct countries, in 2010.
Overall
, Linking Words
it is clear that
other Latin America was the most attractive destination for export for both Linking Words
Argentina
and Use synonyms
Chile
Use synonyms
while
the Linking Words
USA
was the place where Mexico Use synonyms
exports
the most goods. Use synonyms
However
, for both Linking Words
Argentina
and Use synonyms
Chile
, the Use synonyms
USA
contributed the least.
Use synonyms
According to
the pie charts, the export changes in Linking Words
Chile
and Use synonyms
Argentina
were similar. 38% of Use synonyms
Argentina
's Use synonyms
exports
and 31% of Use synonyms
Chile
's Use synonyms
exports
were exported to other Latin American Use synonyms
nations
, respectively, which were the majority of their Use synonyms
exports
. Use synonyms
Moreover
, 26% of the goods exported by Linking Words
Argentina
went to Europe, 20% entered to other Use synonyms
nations
, and 16% came to the Use synonyms
USA
Use synonyms
while
Linking Words
Chile
exported 30% of its Use synonyms
exports
to Europe, 22% of its products to other Use synonyms
nations
, and 18% to the Use synonyms
USA
.
Use synonyms
In contrast
, Mexico sent the majority of its Linking Words
exports
to the Use synonyms
USA
, at 62%. Use synonyms
In addition
, three remaining destinations including Europe, other Latin American countries, and other Linking Words
nations
were exported with the smallest quantity, which was valued at 6% for each.Use synonyms