
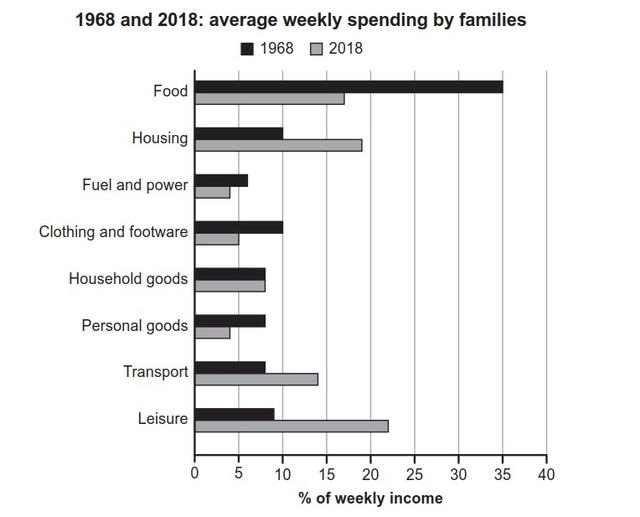
The bar charts provide data about how households in a certain country allocated their weekly income in 1968 and 2018.
Overall
, there was a paradigm shift in the way families spent their weekly income in 1968 compared to 2018. Notably, housing and leisure had overtaken food as the largest expense.
In 1968, families spent most of their weekly earnings on food, with a portion of 30%, Linking Words
while
Linking Words
this
figure decreased dramatically to roughly 17% in 2018. None of the other categories surpassed 10% in 1968. Linking Words
Nevertheless
, in 2018, the proportion spent on housing and leisure was higher than that spent on food, with amounts of approximately 18% and 22%, respectively.
Linking Words
Additionally
, expenditure on transport doubled to about 14% of weekly earnings whilst expenditure on household goods remained unchanged in both years at around 7%. Linking Words
In contrast
, expenditures on fuel and power, clothing and footwear, and personal goods all dropped to 5% or less in 2018.Linking Words