
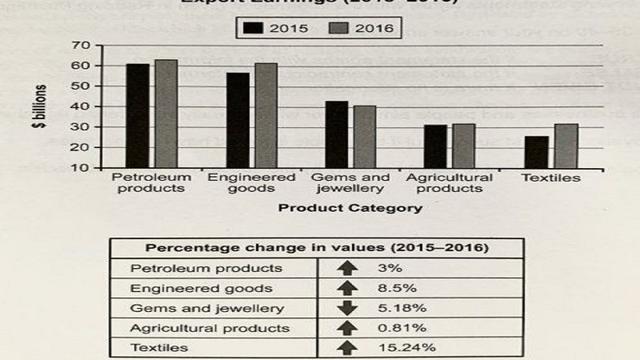
The bar chart above describes the changes in a Country's exported goods from 2015 to 2016. The materials studied are petroleum
products
, engineered goods, gems and jewellery, agricultural Use synonyms
products
Use synonyms
as well as
textiles.
From a first survey of the findings, the levels of Linking Words
export
of each commodity did not vastly change in the selected time period. Petroleum Use synonyms
products
remain the most exported of the group, achieving a 3% increase in their Use synonyms
export
value in 2016. Engineered goods and agricultural Use synonyms
products
see an increase in their Use synonyms
export
as well, the former scoring an 8.5% growth and the latter an 0.81%. Use synonyms
However
, the product whose Linking Words
export
value skyrocketed in 2016, compared to 2015, is textiles, which achieve a 15.24% increase. The only negative change shown by the results regards the Use synonyms
export
of gems and jewellery, which decreases by 5.18% in 2016.
Use synonyms
Overall
, the Country's Linking Words
export
value did not change significantly over the indicated time frame.Use synonyms