
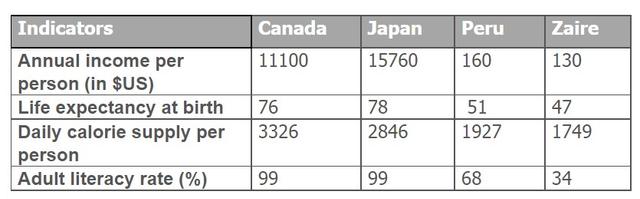
The chart informs about the
indicators
of social and economic for four countries in 1994. Use synonyms
Overall
, it can be seen that Japan has the highest Linking Words
indicators
in the annual revenue per Use synonyms
person
with their possible age and reading habit Use synonyms
while
Zaire was the lowest score in all Linking Words
indicators
.
Income per Use synonyms
person
was the highest in Japan followed by Canada with 15,760 and 11,100 respectively. Use synonyms
Furthermore
, their lifespan expectancy was the highest among three other countries which stand at the age of 78. In the daily calorie supply per Linking Words
person
, it was obvious that Canada can provide more calorie supply to their citizen with 3,326 per Use synonyms
person
. Canada and Japan stand at the same ratio for their adult literacy rate of 99%.
Use synonyms
On the other hand
, the lowest score for the four Linking Words
indicators
occurred in Zaire. Its annual income per Use synonyms
person
, and life expectancy death were the lowest among other countries with 130 and 47 respectively. Their daily supplies of calories and the adult literacy rate were Use synonyms
also
in the lower bracket with scores of only 1749 and 34.Linking Words