The chart below gives information about species used for animal testing in the U.S. Summarise the information by selecting and reporting the main features, and make comparisons where relevant.

The chart below gives information about species used for animal testing in the U.S.

Summarise the information by selecting and reporting the main features, and make comparisons where relevant.
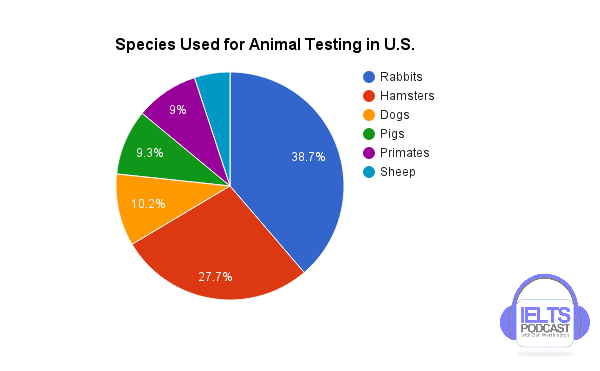
The supplied chart represents data about animal species that are used in
Correct article usage
the U.S
show examples
U.S
Correct your spelling
U.S.
for testing purposes.
Overall
, it is obvious that rabbits are highly demanded animals and go through testing more than any other species. As can be seen that a very small proportion of
diagram
Correct article usage
the diagram
show examples
takes sheep demand in animal testing and the largest one is rabbits which fill 38.7% of the chart.
Furthermore
, hamsters which take
27.7
Change preposition
up 27.7
show examples
% of the chart are in
the
Correct article usage
apply
show examples
second place by their importance in
this
field.
Submitted by amina07id on

Unauthorized use and/or duplication of this material without express and written permission from this site’s author and/or owner is strictly prohibited. Excerpts and links may be used, provided that full and clear credit is given to Writing9 with appropriate and specific direction to the original content.

Common mistake: Your writing should be 150-250 words.
Vocabulary: Only 6 basic words for charts were used.
Vocabulary: The word "chart" was used 3 times.
Vocabulary: Use several vocabularies to present the data in the second paragraph.
What to do next:
Look at other essays: