
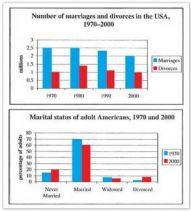
The given bar charts demonstrate the
number
of married people and divorced people in the USA over 3 decades and the marital status of teenagers in America in 1970 and 2000. Use synonyms
Overall
, as can be seen, in the first chart the Linking Words
number
of marriages was the highest trend in both graphs.
Looking at the information in more Use synonyms
details
, the Fix the agreement mistake
detail
number
of marriages was 2,5 in 1970 Use synonyms
As well as
in 1980 Linking Words
while
Linking Words
this
was 1 and 1.4 for divorces. Linking Words
Then
, in 1990 the rate of marriages was 2.3 Linking Words
whereas
in 2000 it was 2. Linking Words
However
, in 1990 and 2000 the Linking Words
number
of divorces remained stable.
When it comes to the second chart, in 1970 the level of married adults was 70% meanwhile it fell to 60%. The figure for people who have never married was 10% in 1970 and 20% in 2000. Use synonyms
Furthermore
, the Linking Words
number
of widowed individuals Use synonyms
10
% in 1970 and 8% in 2000. Eventually, other groups were the lowest trends Add a missing verb
was 10
in contrast
to the aforementioned categories.Linking Words