
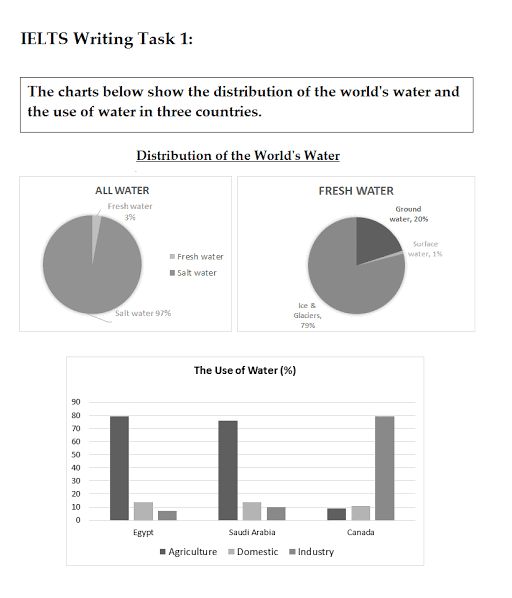
The first diagram illustrates the distribution of global
water
, Use synonyms
while
the bar chart represents the Linking Words
use
of Use synonyms
water
in three different countries (Egypt, Saudi, and Canada) in three different sectors (Use synonyms
agriculture
domestic, and Use synonyms
industry
)
Use synonyms
Overall
, the source of all Linking Words
water
is salt Use synonyms
water
, and the main source of freshwater is ice & glaciers. Canada mainly uses Use synonyms
water
for Use synonyms
industry
, Use synonyms
whereas
Saudi and Egypt Linking Words
use
Use synonyms
water
mainly for Use synonyms
agriculture
.
The first pie chart shows that 97% of the Use synonyms
water
in the world is saltwater compare to 3% of freshwater. In the second pie chart, it can be noted that Use synonyms
water
from ice and glaciers is about 79% of Use synonyms
freshwaterwater
compared to groundwater and surface Correct your spelling
freshwater water
fresh water water
water
(20% and 1% respectively).
In terms of the Use synonyms
use
of Use synonyms
water
, Canada uses most of its Use synonyms
water
in Use synonyms
industry
which is almost 80% compared to Use synonyms
agriculture
and domestic. Both Egypt and Saudi Arabia Use synonyms
use
Use synonyms
water
most of their Use synonyms
water
in Use synonyms
agriculture
compared to domestic and Use synonyms
industry
which was about 15 and 10% respectively.Use synonyms