The table below shows information and predictions regarding the change in percentage of the population aged 65 and above in three countries.

The table below shows information and predictions regarding the change in percentage of the population aged 65 and above in three countries.
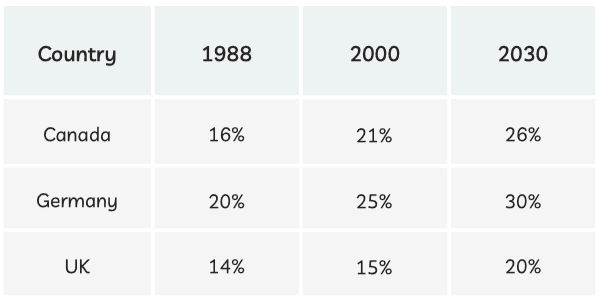
The table illustrates the proportion of the
population
aged 65 in three countries between 1988 till 2030.
Overall
, it is clearly evident that there has been an increase in the elder
population
since 1988 among foreign countries.
Firstly
, the elder in the German
population
has witnessed the highest increase among other countries, from 20% in 1988 to 30% in 2030, Whilst Canada has the second largest growing elder
population
, with a 5% increase every period.
Submitted by vanshbisht11 on

Unauthorized use and/or duplication of this material without express and written permission from this site’s author and/or owner is strictly prohibited. Excerpts and links may be used, provided that full and clear credit is given to Writing9 with appropriate and specific direction to the original content.

Sentences: Add more complex sentences.
Basic structure: Write more paragraphs.
Basic structure: Add more body paragraphs.
Common mistake: Your writing should be 150-250 words.
Basic structure: Write more paragraphs.
Vocabulary: Replace the words population with synonyms.
Vocabulary: Only 4 basic words for charts were used.
Vocabulary: The word "increase" was used 3 times.
Topic Vocabulary:
  • percentage change
  • population
  • aged 65 and above
  • information
  • table
  • data
  • trends
  • patterns
  • comparison
  • predicted
  • future
  • findings
  • comment
What to do next:
Look at other essays: