
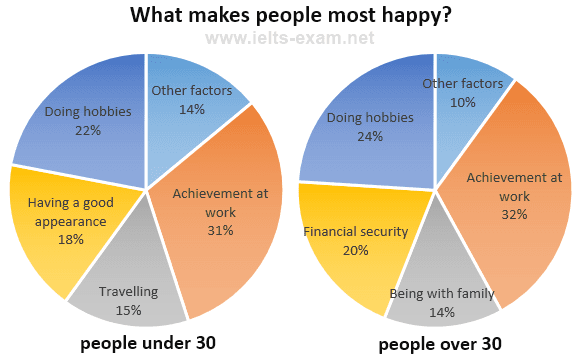
The two pie charts illustrate what makes people happy between 20 and 50 years of age. It is clear from these two charts that there are different rates in five exercises and the achievement of work is the same in both pies and it is the highest percentage in both ages between 32% and 31%.
Looking in more detail, the
rate
of other factors of adults under 30 is less Use synonyms
rate
than the other exercises by 14%. After that, the Use synonyms
rate
of travel increased by about 1 % than other factors. What is more, having a good appearance rises to 18%, and doing hobbies Use synonyms
also
slightly grows to 22%.
Linking Words
Moreover
, the percentage of other factors for people over 30 is less around about 10%. Linking Words
Then
, being with a family Linking Words
rate
go up to 14%, and Use synonyms
also
doing hobbies rapidly grow to 24%. Linking Words
On the other hand
, the Linking Words
rate
of financial security exercises slightly drops to 20% for doing hobbies.Use synonyms