You should spend about 20 minutes on this task. The table illustrates the proportion of the monthly household income of five European countries spend on food and drink, housing, clothing, and entertainment Summarize the information by selecting and reporting the main features and make comparisons where relevant. Write at least 150 words.

You should spend about 20 minutes on this task.

The table illustrates the proportion of the monthly household income of five European countries spend on food and drink, housing, clothing, and entertainment

Summarize the information by selecting and reporting the main features and make comparisons where relevant.

Write at least 150 words.
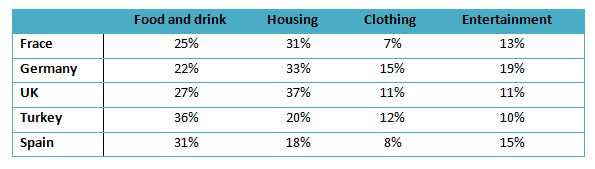
The tabulated results show the percentage of
monthly
Add an article
the monthly
a monthly
show examples
income of five European countries that spend on
entertainment
, clothing, housing and meals. French
house holds
Correct your spelling
households
show examples
spend
one quarter
Add a hyphen
one-quarter
show examples
of their monthly income on meals and the highest percentage
for
Change preposition
on
show examples
housing, and more than twice as much on
entertainment
than clothing. A similar trend can be observed in Germany and UK where most of the money is spent on housing followed by meals,
entertainment
and clothing.
However
, in Turkey and
Spain
Add a comma
,Spain
show examples
people spend more on food and drinks than housing.
In addition
, locals in Turkey, spend more on clothing than
entertainment
and
viceversa
Correct your spelling
vice versa
in Spain.
Submitted by shuaibshariff321 on

Unauthorized use and/or duplication of this material without express and written permission from this site’s author and/or owner is strictly prohibited. Excerpts and links may be used, provided that full and clear credit is given to Writing9 with appropriate and specific direction to the original content.

Introduction: The introduction is missing.
Introduction: The chart intro is missing.
Common mistake: Your writing should be 150-250 words.
Basic structure: Change the third paragraph.
Introduction: The chart intro is missing.
Vocabulary: Replace the words entertainment with synonyms.
Vocabulary: Only 3 basic words for charts were used.
Vocabulary: The word "percentage" was used 2 times.
Vocabulary: Use several vocabularies to present the data in the third paragraph.
What to do next:
Look at other essays: