
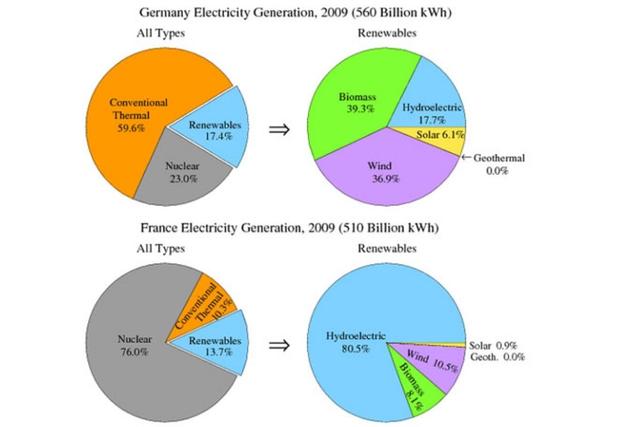
The pie charts illustrate the proportions of the different kinds of sources that produced electricity in
Germany
and Use synonyms
France
in 2009. Use synonyms
Overall
, most of the electricity consumed in Linking Words
Germany
is generated from conventional thermal Use synonyms
energy
systems, Use synonyms
while
it is produced from nuclear Linking Words
energy
in Use synonyms
France
.
Conventional thermal Use synonyms
energy
contributes the least in Use synonyms
France
with 10.3%, Use synonyms
whereas
renewable Linking Words
energy
comprises only 17.4% of the chart of Use synonyms
Germany
. Even though, renewables correspond to the smallest proportion of the chart, the percentage is still higher than in Use synonyms
France
(13.7%).
Hydroelectric made up the biggest portion of the renewable Use synonyms
energy
production in Use synonyms
France
with 80.5%, it only provided 17.7% of the green Use synonyms
energy
in Use synonyms
Germany
. In comparison, Use synonyms
Germany
generated most of its sustainable Use synonyms
energy
through biomass which corresponds to 39.3% of the chart.
Geothermal Use synonyms
energy
was not developed enough to get into the charts with a number in both countries, on the other side solar Use synonyms
energy
had the second lowest percentages in Use synonyms
France
and Use synonyms
Germany
with 0.9% and 6.1% respectively. In total, Use synonyms
Germany
generated 50 billion kWh more electricity than Use synonyms
France
in 2009.Use synonyms