
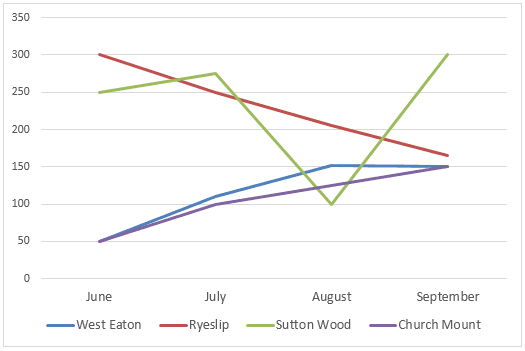
The line chart gives information about the
number
of Use synonyms
books
that have been borrowed from 4 different libraries in the village.
Use synonyms
Overall
, it is noticeable that Ryeslip had the highest Linking Words
number
from the start but in the Use synonyms
end
Sutton Wood became the first.
From the statistics, it can be inferred that both West Eaton and Church Mount experienced a rise in the Add a comma
,end
number
of Use synonyms
books
being borrowed from 50, in order West Eaton rise more rapidly when the Use synonyms
number
of Church Mount increased minimally Use synonyms
then
reached a common level of 150 in September.
A deep analysis of the line chart provided reveals that the Linking Words
number
of Use synonyms
books
borrowed at Ryeslip went down enormously from 300 in June to under 150 in September. At the same time, Sutton Wood recorded a sharp fall to 100 Use synonyms
books
borrowed in July Use synonyms
then
Linking Words
stared
to recover in August and reached Correct your spelling
started
the
peak of 300 in September.Correct article usage
a