
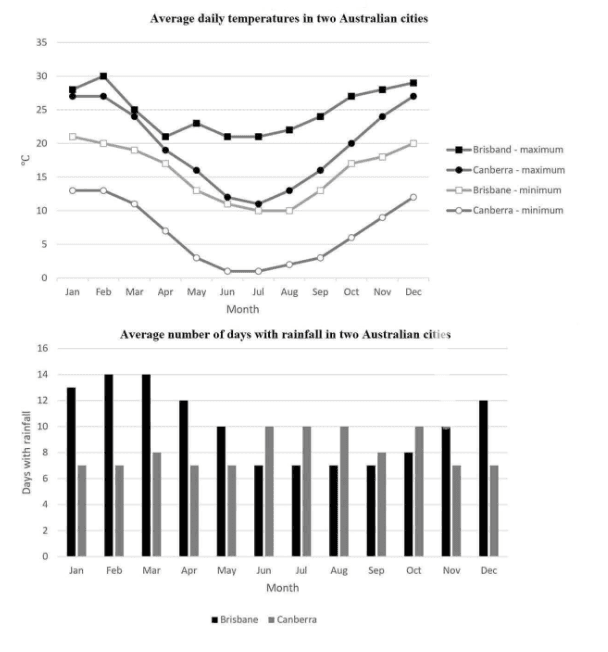
The two figures illustrate daily temperatures in Celcius and the number of rainfall days in each month all over a year in Brisbane and Canberra.
Overall
, in the line chart, despite the max Linking Words
temperature
in Brisbane, the other three lines have the same trend. In the column graph, the Use synonyms
first
city has more rainy days than the latter.
On the one hand, in Brisbane, the minimum Use synonyms
temperature
of it starts at 26*C in the Use synonyms
first
month and Use synonyms
then
drops to the coolest at 11*C in July, after that, it plunges back to the original Linking Words
temperature
Use synonyms
at the end
of the year, Linking Words
while
its maximum Linking Words
temperature
fluctuates in the Use synonyms
first
six Use synonyms
months
, which starts 28 and reach the top at 30*C in February and end at 21 in June, and Use synonyms
then
gradually increase to 29 degrees Celcius in December. Linking Words
On the other hand
, in Canberra, the top and bottom heat of Linking Words
months
, which start at 21 and 13, and end at 20 and 11 respectively, have the same trend, which is a drop from the top in January and Use synonyms
then
steadily increase to another top in December.
On Linking Words
further
analysis, the column chart shows that Brisband has more rainy days than Canberra, which is 7 Linking Words
months
, the Use synonyms
first
five Use synonyms
months
and the Use synonyms
last
two Linking Words
months
, compared to 5 Use synonyms
months
which are in the middle of the year.Use synonyms