
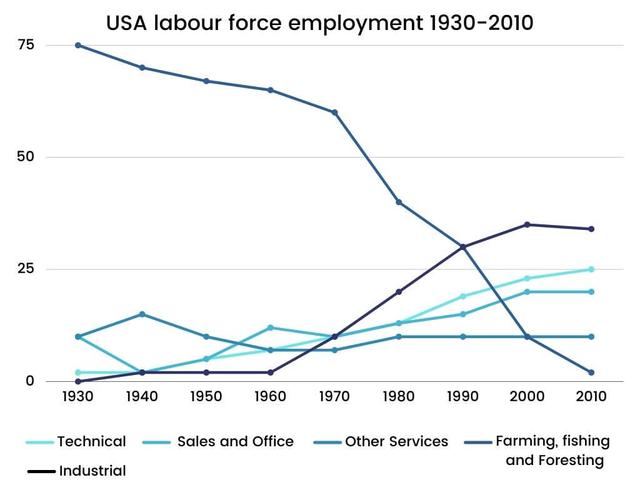
The line graph compares the
employment
Use synonyms
rate
in the USA and how Use synonyms
this
Linking Words
rate
changes over the course of 8 decades starting from 1930.
Use synonyms
Overall
, it is obvious that almost the proportion of objects in the graph increased with the exception of the industrial and other services Linking Words
employment
Use synonyms
rate
over the period of 80 years. Use synonyms
Moreover
, the figure for industrial Linking Words
employment
was the highest in most years.
In the first Use synonyms
year
, the Use synonyms
employment
of industry accounted for the largest with nearly 80% Use synonyms
while
that of other services was just about 10%. In the following decade, after a gradual decrease of 10% in the industrial employee Linking Words
rate
in 1970, it diminished to approximately 3% by the Use synonyms
year
2010. In terms of the percentage of other service employees, there was a small increase of 5% in 1940, but it dropped in 1950 to the same level as it was in the beginning Use synonyms
year
, after which the figure Use synonyms
leveled
off and remained relatively unchanged throughout the remainder of the period.
Moving to the sales and office, technical, Change the spelling
levelled
and
farming, fishing, and foresting Correct word choice
apply
employment
Use synonyms
rate
, they ranged from 0 to 10% in 1930. After many minor fluctuations, the figure for industrial and technical employees rose and roughly converged at 35%, Use synonyms
while
that of sales and office employees climbed slightly to precisely 20% in the Linking Words
last
Linking Words
year
.Use synonyms