
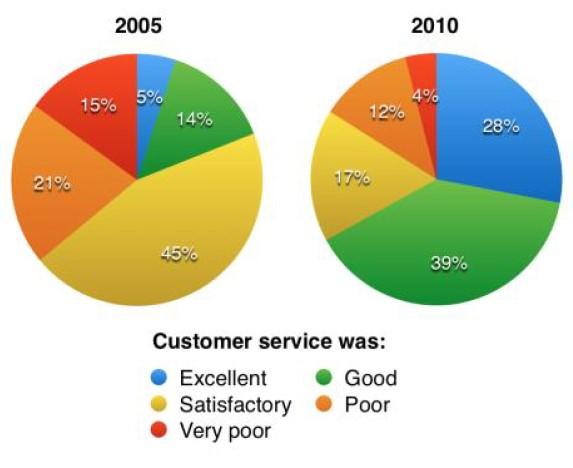
The pie charts compare the different ratings of customer
service
surveyed 100 guests in the Parkway Hotel in two separate years.
Use synonyms
It is clear that
consumers became more satisfied with the hotel Linking Words
service
over the period shown as the ratings of “excellent” and “good” witnessed an increase, Use synonyms
while
the proportions of negative Linking Words
feedback
declined to varying degrees.
In 2005, only 5% of customers considered the hotel Use synonyms
service
excellent, Use synonyms
whereas
the figure grew approximately sixfold in five years, to 28%. The trend was the same for marking the Linking Words
service
as “good”, which rose from 14% to 39%, making up the biggest portion of the survey.
Use synonyms
By contrast
, the year 2010 saw the percentage of rating as “very poor” plummet from 45% to 17%, which was followed by satisfactory Linking Words
feedback
, with the proportion decreasing by 9% in the second survey. At the same time, Use synonyms
although
a quarter of Linking Words
feedback
rated the Use synonyms
service
as “poor” in 2005, the figure was cut by three quarters in 2010, at 4% which became the least popular Use synonyms
feedback
.Use synonyms