
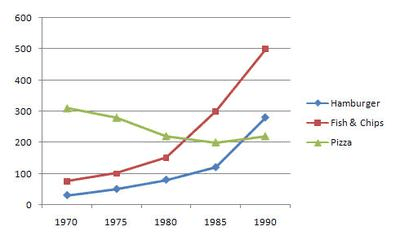
The presented illustration of the graph represents the expenditure on junk food in the Uk between 1970 and 1990.
In general,the figures for the two main fast food increased rapidly until the
year
1990,Use synonyms
whereas
the consumption of Linking Words
pizza
changed slightly Use synonyms
at the end
of the Linking Words
year
.
It is interesting to note that at the beginning of the Use synonyms
year
, the Use synonyms
data
for Use synonyms
pizza
emerged with 300 Use synonyms
grams
, which was much higher than that of convenience foods.Use synonyms
Furthermore
,the amount of Linking Words
pizza
decreased sharply reaching just over 200 Use synonyms
grams
in 1980,Use synonyms
while
in Linking Words
this
Linking Words
year
consumption of fish and cheaps increased dramatically.Use synonyms
Then
Linking Words
this
Linking Words
data
reached a peak of 500 Use synonyms
grams
in 1990.
Use synonyms
On the contrary
,the expenditure on hamburgers increased gradually from 1970 to 1980,showing the same growth as fish and chips.After that,Linking Words
this
Linking Words
data
moderately increased in the Use synonyms
last
5 years but Linking Words
as a consequence
,the consumption of hamburgers rapidly went up reaching just under 300 Linking Words
grams
,that means Use synonyms
this
Linking Words
data
crossed and got the highest point than a Use synonyms
pizza
.Use synonyms