
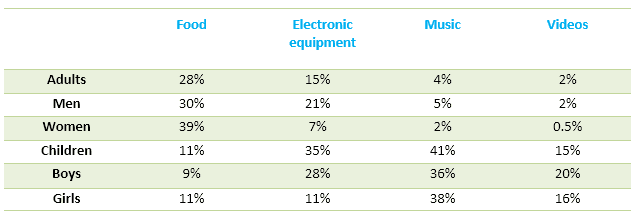
Presented for comparison is a table detailing figures for the budget's percentage of British grown people and youngsters on 4 ordinary items throughout 1998. The units are out of 100%.
Overall
, it can be seen that the rate of children spent a much of money on music, Linking Words
while
adults spent a much on food. Linking Words
Additionally
, it can be Linking Words
also
observed that spending on videos accounted for the smallest figures in both generations.
Looking at cuisine and electronic equipment figures in Linking Words
further
detail, it is evident that expenditures of adults in foodstuff led position among other items, especially for women who spent nearly two-fifths, Linking Words
whereas
men’s expenditure was only 14%. In terms of kids who spent the least on cooking, Linking Words
however
, their spending was more considerable on electronic equipment which took up 23% in general.
Turning to the remaining items ‘data, it is noticeable that there was a similarity between men’s and women’s expenditure on music which both accounted for one in twenty. Linking Words
In addition
, younger people spent the majority in the same category which comprised 40% Linking Words
overall
. Regarding videos, which were used the least by grown persons in the whole table, were close to nothing.Linking Words