
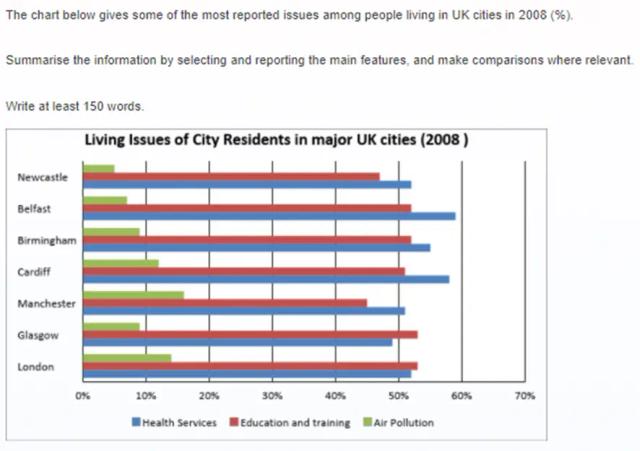
The given bar chart demonstrates the parts of living issues of citizens in seven big cities in the UK in 2008, which were divided into three groups.
Overall
, Linking Words
it is clear that
health services and education and training have the most significant issue, Linking Words
while
air pollution was the least important.
Linking Words
According to
the highest figures, over 45% of issues were registered in health services and education and training programs in all cities. The highest percentage was in Belfast and Cardiff in health services 58% and 59% approximately.
Linking Words
However
, In Manchester was the least percentage in the well-being system almost 45% and 51% on teaching and learning programs.
Linking Words
On the other hand
, air pollution's highest rates were in Manchester only 16% , whilst the least was in Newcastle just 5%. Despite Linking Words
this
, in the other Linking Words
cities
the air pollution proportions remained between 8% and 12% .Add a comma
,cities