
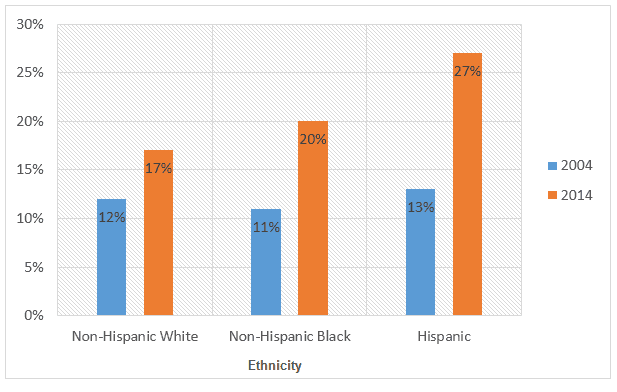
The graph explains the proportion of overweight boys and girls aged from 12 to 19 in the US
according to
their background, in 2004 and 2014.
Generally speaking, what stands out from the diagram is that in 2014 the percentage of obesity was higher among all studied groups.
In 2004, Hispanics were the fattest group with 13%, Linking Words
while
Linking Words
non-Hispanic
white placed second with only a 1% difference. Use synonyms
Similarly
, Linking Words
non-Hispanic
black people were Use synonyms
the
least overweight category with 11% and 1% difference Change preposition
in the
with
Change preposition
from
non-Hispanic
white.
In 2014, same in 2004, Hispanics had the highest percentage of fat people with 27%. Use synonyms
However
, the change between each bracket was much greater compared to ten years ago, and the figure for Linking Words
non-Hispanic
white and Use synonyms
non-Hispanic
black was 17% and 20% respectively.Use synonyms