
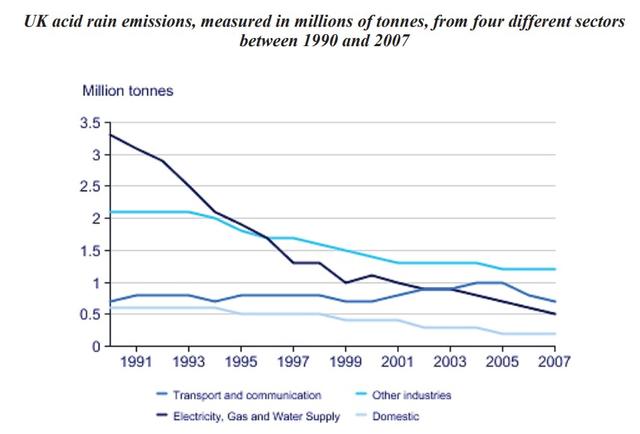
The line graph compares the data based on four categories about the amount of acid rain emissions per
million
Use synonyms
tonnes
that they are produced over a period of 17 years in British.
From the statistics, it can be concluded that the electricity, gas, and water supply had a dramatic decline. Use synonyms
also
, transport and communication experienced partial growth between 1990 and 2007.
In 1991, electricity, gas, and water supply responsible for nearly 3,5 Linking Words
million
Use synonyms
tonnes
of acid rain emissions experienced a sharp fall and reached 0.5 Use synonyms
million
Use synonyms
tonnes
in 2007. Use synonyms
In contrast
, the transport and communication sector started with just over 0.5 Linking Words
million
Use synonyms
tonnes
and reached a high of 1 Use synonyms
million
Use synonyms
tonnes
. At all, experienced partial growth.
The amount of production in the domestic sector stood at approximately 0.6 Use synonyms
million
Use synonyms
tonnes
and faced a smooth decrease by the end of 2007. Use synonyms
On the other hand
, other industries evened out at just over 2 Linking Words
million
Use synonyms
tonnes
for three initial years and experienced a swift drop of 1 Use synonyms
million
Use synonyms
tonnes
over Use synonyms
this
period.Linking Words