
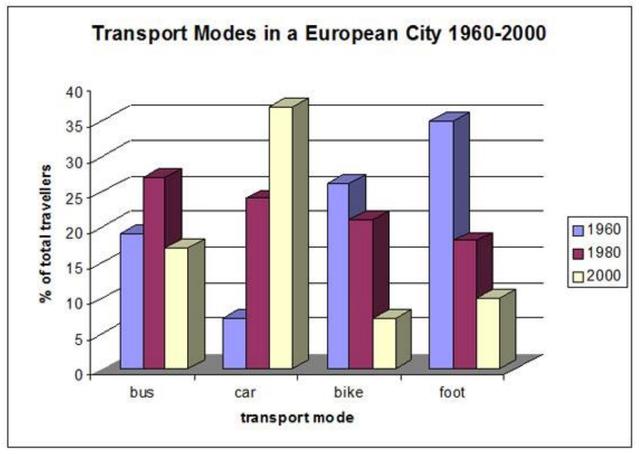
The bar graph illustrates the different types of transport used to travel in European cities through three periods.
overall
, the most popular method of transportation to and from work in the sixties was by foot ; Linking Words
however
, the percentage kept declining over the years . on the other hand , the least popular manner of transport in the sixties was the car ,but it kept surging during the years .
in 1960 the better method of transportation to and from the job was by walking just over 30% of people used Linking Words
this
approach . Linking Words
while
the percentage kept plunging over the years .in the eighties ,only 15% of users used Linking Words
this
type,and by a millennium , Linking Words
this
has dropped Linking Words
further
to around 10% .
the least famous manner of transport in the sixties was cars , but it kept increasing .in 1960 only 5% of people used cars, but by 1980 Linking Words
this
had grown to around 22% . By 2000 the percentage has risen to approximately 35%.Linking Words