
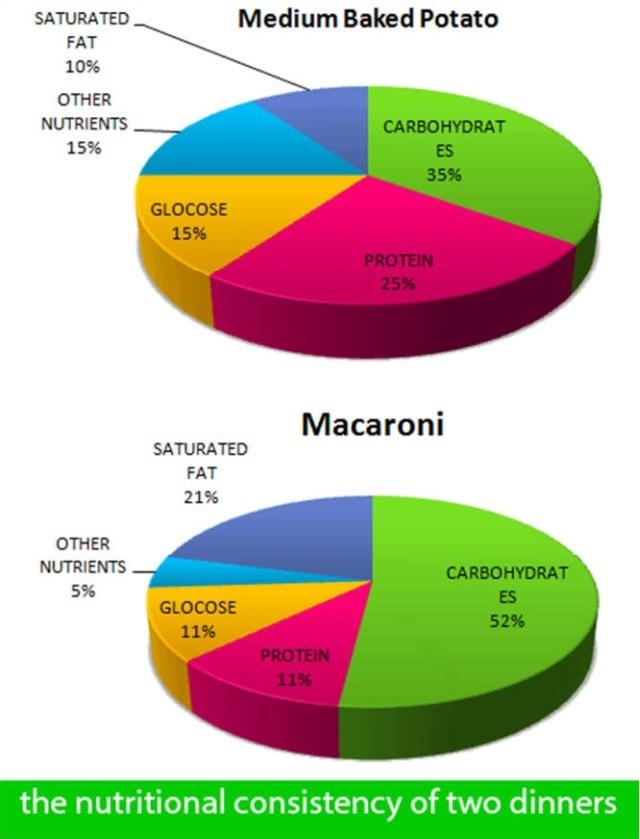
These provided pie graphs illustrate the composition of two kinds of dinner.
Overall
, it can be seen that each meal was made of five nutritional components Linking Words
such
as carbohydrates, protein, glucose, saturated fats, and other nutrients, but the percentage of each item varies Linking Words
according to
the sort of dinner.
Linking Words
To begin
, carbohydrates were the first greatest component of each meal, Linking Words
therefore
; they represented 52% of Linking Words
Macaroni
and 35% of Use synonyms
Medium
baked Use synonyms
potato
. Use synonyms
In addition
to that, protein was the second ingredient in Linking Words
Medium
backed Use synonyms
potato
, as; it accounted for 25%, but for Use synonyms
Macaroni
, it represented 11% of all ingredients, so; it became the third component in Use synonyms
Macaroni
.
Regarding glucose and other nutrients, their percentages were equal in Use synonyms
Medium
baked Use synonyms
potato
, at 15%, Use synonyms
whereas
each one had a different ratio in Linking Words
Macaroni
, which was 11% for glucose and 5% for other nutrients. Use synonyms
Moreover
, the proportion of saturated fat was 21% in Linking Words
Macaroni
, which was more than twice its ratio in Use synonyms
Medium
baked Use synonyms
potato
, at 10%.Use synonyms