
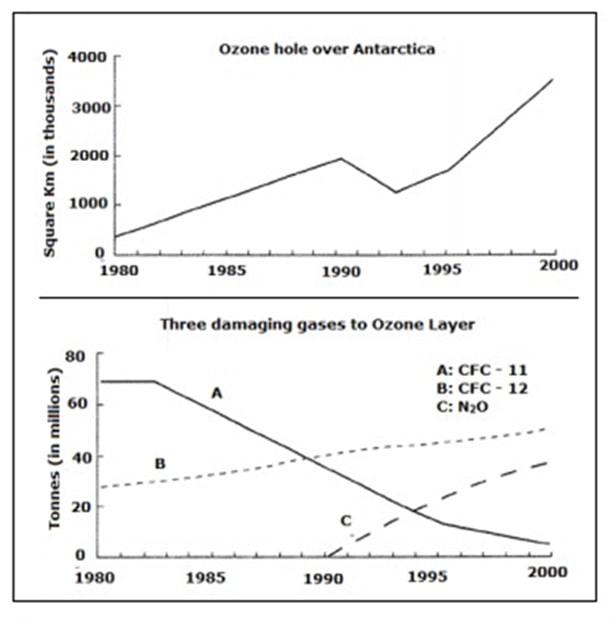
The graph illustrates the information
of
disruption in the Ozone layer above Antarctica.It Change preposition
on
also
shows three different gases whichLinking Words
making
it worst in the Wrong verb form
made
years
1980 to 2000.
Use synonyms
Overall
, it can be said that as the period passed the damage in the Ozone layer over Antarctic people Linking Words
also
saw an upward trend . In its addition , there were other factors Linking Words
also
involved in the harmful cause which destroyed the same.
Linking Words
To begin
with,only between 1990 and 1995 there was less effect seen in the damage done as compared to the other three Linking Words
years
(1980,185 and 2000).The harm started at about 300 thousand square km and reached above 3000 thousand square km.
Use synonyms
Moreover
,in the same Linking Words
years
from 1980 to 2000 there were three distinct gases namely CFC-11,CFC-12 and N20 were seen in vandalizing the Ozone. Gas A declined its effect as the Use synonyms
years
passed and went down to negligible Use synonyms
while
gas B kept its effect as it is.Linking Words