
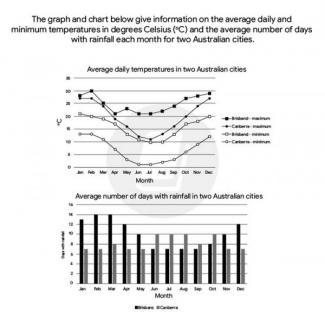
The two data
illustrates
the average daily Correct subject-verb agreement
illustrate
temperature
in Use synonyms
degreea
Correct your spelling
degrees
degree
celcius
and Correct your spelling
celsius
average
Correct article usage
the average
numver
of days with rainfall each month for two Australian cities.
Correct your spelling
number
Overall
, what stands out from the chart is the fluctuation of Linking Words
temperature
and average rainfall in both cities each month.
In the month of Use synonyms
january
Canbera's Change the capitalization
January
minimun
Correct your spelling
minimum
temperature
was approximately 12 Use synonyms
degrees
and the maximum was around 25 Use synonyms
degrees
. Use synonyms
On the other hand
, Brisbane experienced a Linking Words
temperature
ranging from 20 to 25 Use synonyms
degrees
. Canberras' Use synonyms
temperature
Use synonyms
drop
and reached its lowest point in July at around 2 Wrong verb form
dropped
degrees
Use synonyms
celcius
Correct your spelling
celsius
then
, depicts a steadily increasing Linking Words
temperature
that hovers around 20% in Use synonyms
december
. Change the capitalization
December
On the other
Linking Words
hand
Brisbanes' Add a comma
,hand
temperature
shows a sudden decrease in Use synonyms
temperature
in Use synonyms
february
. The coldest Change the capitalization
February
temperature
was just around 10 Use synonyms
degrees
in the Use synonyms
montth
of July Correct your spelling
month
then
, Linking Words
subsequently
increased and reaches its hottest Linking Words
temperature
at around 30 Use synonyms
degrees
in Use synonyms
december
.
Change the capitalization
December
In contrast
, Brisbane accounts for the highest rainfall in Linking Words
february
Change the capitalization
February
while
Canberra is the smallest Linking Words
most
of the months.Change preposition
in most