
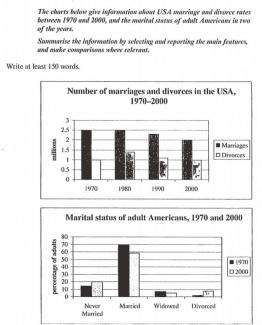
Out of the two charts given below the first one shows the record of
marriages
and Use synonyms
divorces
in the USA and the second graph shows the Use synonyms
percentage
of 4 categories related to the marital status of people in the USA. The data is recorded for 30 Use synonyms
years
between 1970 to 2000.
The first show indicates that both Use synonyms
divorces
and Use synonyms
marriages
decreased from 1980 onwards and Use synonyms
similarly
the second chart shows a decreasing trend in Linking Words
marriages
and widowed individuals, Use synonyms
while
never married people and divorced people slightly increased during these 30 Linking Words
years
.
If we look at the first graph, it displays that number of Use synonyms
marriages
was at its peak between 1970 and 1980 at the value of 2.5 Use synonyms
million
but after that, it started decreasing and it declined to only 2 Use synonyms
million
in the year 2000. Regarding Use synonyms
divorces
, the given information shows that the divorce rate was 1 Use synonyms
million
in the year 1970 and Use synonyms
then
it jumped to all Linking Words
time high
value of about 1.5 Add a hyphen
time-high
million
but after that, it started declining and came back to 1 Use synonyms
million
in the year 2000.
In the second graph, the most prominent data is the Use synonyms
percentage
of married adults which decreased in 30 Use synonyms
years
at the rate of almost 10% Use synonyms
while
the Linking Words
percentage
of never married and adults showed an increase in the Use synonyms
percentage
of about 0.5 and 0.7 respectively.
Use synonyms
Overall
, the 30 Linking Words
years
Use synonyms
data
Change preposition
of data
of
US citizens showed that Change preposition
on
marriages
and Use synonyms
divorces
decreased.Use synonyms