
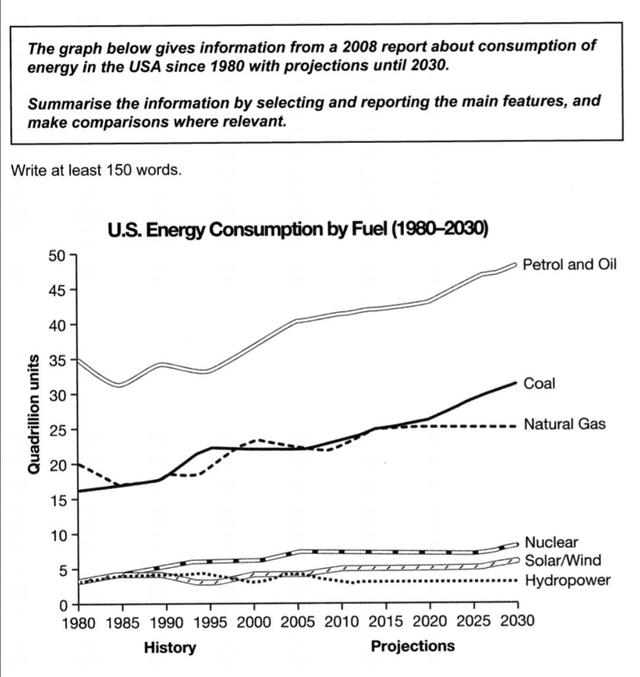
The graph depicts the
energy
Use synonyms
consumption
by fuel in the USA from 1980 and its predictions until 2030. Use synonyms
In addition
, the graph Linking Words
also
shows six types of Linking Words
energy
Use synonyms
consumption
by Use synonyms
fuels
, those are Use synonyms
petrol
and Use synonyms
oil
, coal, natural gas, nuclear, solar or wind, and Use synonyms
hydropower
. One interesting thing is the usage of the Use synonyms
fuels
will not decrease in number in the slightest bit until the year 2030, except for Use synonyms
hydropower
, which was predicted to be stagnant until 2030.
Use synonyms
Petrol
and Use synonyms
oil
was the most consumed Use synonyms
energy
in the Use synonyms
last
43 years and it was predicted that it will increase in number until 7 years ahead. Linking Words
Besides
, the other main feature that can be interpreted from the graph is the steepest increase in Linking Words
consumption
of Use synonyms
petrol
and Use synonyms
oil
, which was predicted to increase by 15 quadrillion units in 2030. Use synonyms
On the other hand
, the usage of Linking Words
hydropower
Use synonyms
fuels
was predicted to stay still at less than 5 quadrillion units until 2030.
Use synonyms
To conclude
, the Linking Words
energy
Use synonyms
consumption
by Use synonyms
fuels
ranked from the growth in number is Use synonyms
petrol
and Use synonyms
oil
, coal, natural gas, nuclear, solar or wind, and Use synonyms
hydropower
(in order).Use synonyms