
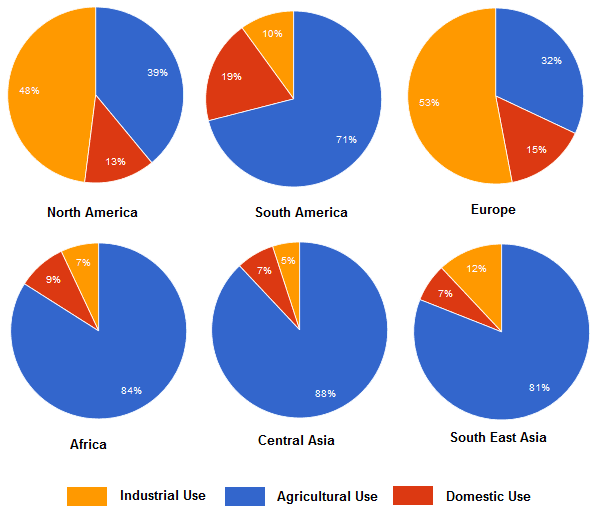
The pie charts below display the data on
water
Use synonyms
consumption
by six different regions of the world.
From the available data, it is obvious that most of the Use synonyms
water
is used for agricultural Use synonyms
purposes
, Use synonyms
while
the least of the Linking Words
water
is used for domestic Use synonyms
purposes
.
Considering the analytics for agriculture and domestic Use synonyms
consumption
of Use synonyms
water
, the data shows that most of the Use synonyms
water
is used by plantations all over as compared to Use synonyms
water
used for household and Industrial Use synonyms
purposes
.
Among the given regions, Central Use synonyms
Asia
used most of the Use synonyms
water
in the field 88%, Use synonyms
while
Europe used the least Linking Words
water
in Use synonyms
this
category 32%. Linking Words
Similarly
, Africa comes second South East Linking Words
Asia
comes third and Use synonyms
then
North Linking Words
America
with Use synonyms
water
Use synonyms
consumption
percentages are 84%,81% and 39% respectively.
Use synonyms
In addition
, Central Linking Words
Asia
consumed the lowest percentage of Use synonyms
water
domestically at 7%, Use synonyms
while
South Linking Words
America
is at the top of the list in Use synonyms
this
category with a Linking Words
water
Use synonyms
consumption
percentage of 19%.
About the third group which is Use synonyms
water
usage for industrial Use synonyms
purposes
in six regions of the world, given charts show that Europe consumes 53% of Use synonyms
water
to Use synonyms
fulfill
its industrial requirement, Change the spelling
fulfil
while
Central Linking Words
Asia
only uses 5% for Use synonyms
this
purpose. Linking Words
Furthermore
, North Linking Words
America
, East Use synonyms
Asia
, South Use synonyms
America
and Africa consume 48%,12%,10%, and 7% of Use synonyms
water
for industrial use.Use synonyms