
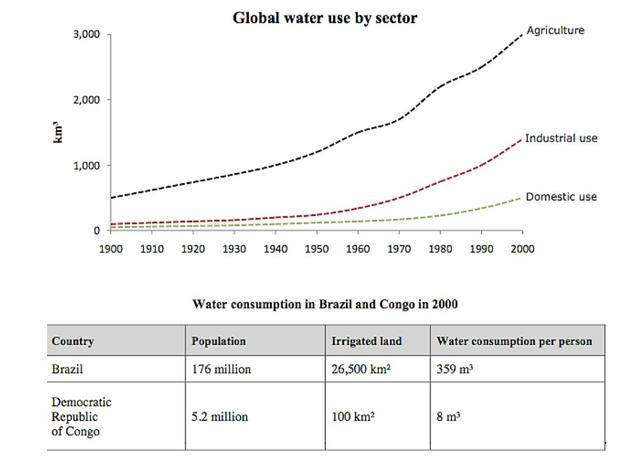
The charts illustrate global
water
usage in terms of agriculture, industrial use, and home use over the period of 11 years, from 1900 to 2000. Use synonyms
Also
, it compares the consumption of Linking Words
water
in two separate countries, Use synonyms
Brazil
and Use synonyms
Congo
in 2000.
From the figures, it can be inferred that worldwide consumption increased significantly over these years. Use synonyms
In addition
, agriculture always accounted for the highest proportion. Linking Words
Besides
, Linking Words
It is clear that
each person in Linking Words
Brazil
consumed considerably more Use synonyms
water
than in Use synonyms
Congo
.
In 1900, the amount of Use synonyms
water
dedicated to agriculture was around 500km3, and after 10 years, experienced a dramatic rise and reached 3000km3. Use synonyms
On the other hand
, industrial and domestic use stood at approximately 100 km3, and by the end of 2000, both saw a smooth increase and reached 1200 and 500 km3 respectively.
In 2000, Linking Words
due to
a noticeable difference in population which is 176 million in Linking Words
Brazil
and 5.2 million in Use synonyms
Congo
, the consumption in Use synonyms
Brazil
was much higher than in it which is 359 and 8 m3. Use synonyms
Furthermore
, it could be explained why the amount of irrigated land in Linking Words
Brazil
is 265 times more than in Use synonyms
Congo
.Use synonyms