
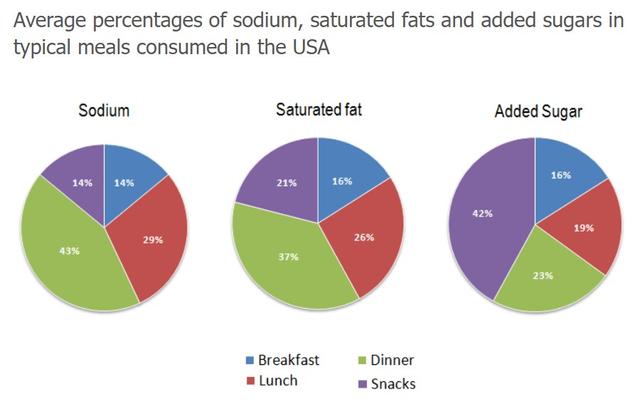
The pie charts provide information on the proportion of
sodium
, saturated fat and added Use synonyms
sugar
in typical Use synonyms
breakfast
, lunch, snack and Use synonyms
dinner
which may lead to poor health if consumed too much.
Use synonyms
Overall
, Linking Words
sodium
and saturated fat were high in the typical Use synonyms
dinner
and those were lower in the typical Use synonyms
breakfast
. Use synonyms
While
considering the added Linking Words
sugar
factor, it represented the highest Use synonyms
value
in the typical snacks and the lowest Use synonyms
value
in the Use synonyms
breakfast
.
Use synonyms
Sodium
and saturated fat showed the highest Use synonyms
value
in Use synonyms
dinner
at 43% and 37% respectively. In comparison, added Use synonyms
sugar
contained in the Use synonyms
dinner
is at a moderate level (23%). Use synonyms
On the other hand
, all three factors in Linking Words
breakfast
showed their portion in the range of 14%-16%.
The highest Use synonyms
value
of added Use synonyms
sugar
is represented in the snacks. Use synonyms
However
, the other two nutrients were between 14%-21%. The typical lunch contained Linking Words
sodium
, saturated fat and added Use synonyms
sugar
at 29%, 26% and 19% respectively.Use synonyms